Wednesday, July 20, 2016

Apollo-11 Moon mission: Colossus 2A code


As the Project Apollo-enthusiasts and NASA-buffs would already be aware, the computer source code for Apollo-11 Moon mission is now available on GitHub. The software, code-named as "Colossus 2A" was already in public domain, courtesy of NASA, but now it would be more accessible to all the nerds, who have already started dissecting it.
Here's the URL:
https://github.com/chrislgarry/Apollo-11


A quick glance reveals that the programmers writing this historic piece of software had a great sense of humour. The program that controlled main rocket sequence was written in a file named as: BURN_BABY_BURN--MASTER_IGNITION_ROUTINE.s

At another place, the code comments have a paragraph from Shakespeare. 
And, the line #666 is identified as “NUMERO MYSTERIOSO”.

Friday, June 17, 2016

Infographic: Branched antaakshari

Everyone of us has played 'antaakshari': The music game in which a team starts with a song, and, using its last letter, the other team begins with theirs.
This infographic takes this idea further. I started with a line of a song, and its every word (except the first) led to the next song, resulting in an exponentially branched-out structure. 


The songs were selected from memory, so there are gaps to be filled.

Thursday, June 16, 2016

Infographic: Brand reality


We live in a brand-saturated world. No matter what we do, we are always interacting with some brand or the other.
So, I created this infographic, which shows the ones that I currently use. 


A few notes: 
  • The brands depicted here are solely my personal choices, and do not represent that of my family members. 
  • The list is not exhaustive, nor definitive; some brands may change over time. 
  • And, the logos used here are only for informative purposes and their copyrights/trademarks belong to their owners.

Wednesday, June 15, 2016

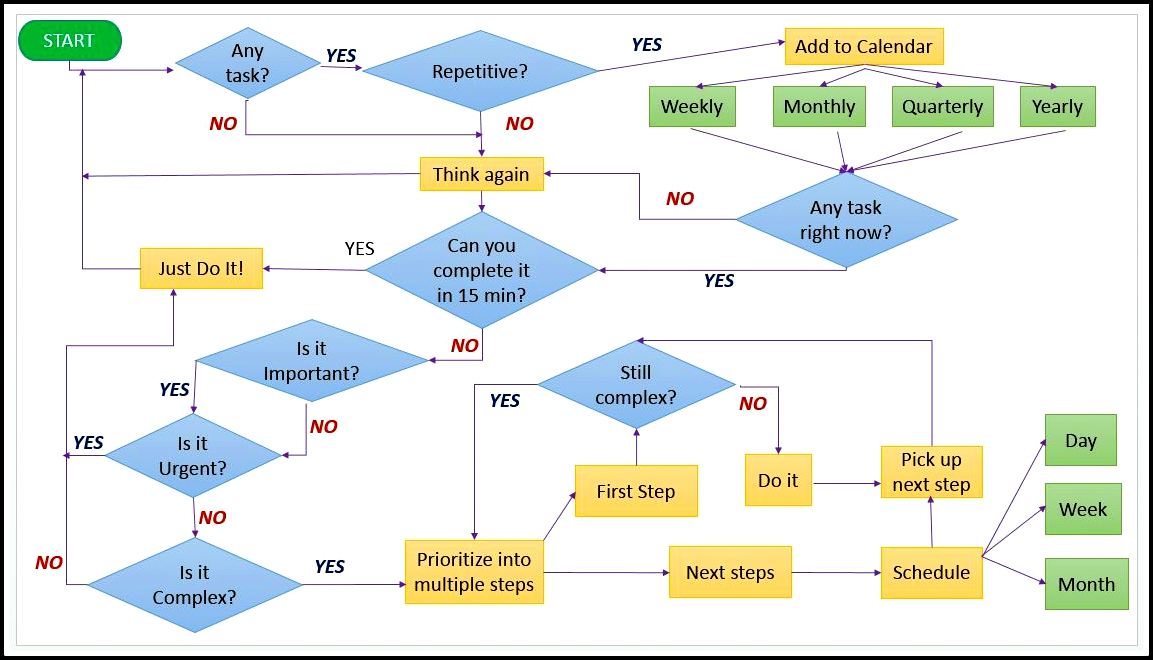
Infographic: Decision flowchart

A flowchart is a visual representation of an algorithm, the logical flow of a computer program. The first flowchart I had created ages ago was rather primitive: It described the steps to receive a phone call. 

Well, this infographic is a bit more ambitious: It depicts the decision-making process that I plan to implement for my day to day activities going forward. 


Let us see. 

Tuesday, June 14, 2016

Infographic: Blood group distribution

Today, June 14, Google displayed a doodle in the honour of Karl Landsteiner, who identified the major blood groups. Today's infographic from me is also a tribute to the same man. 


The information is collected from web sites such as RedCrossBlood.Org.
The infographic is for informational purposes only and should not be considered as medical advice.

Monday, June 13, 2016

Infographic: Relativity Chart

Considering my immense difficulties in grasping and remembering the relationships, last weekend I created this quick infographic. The table should be self-explanatory enough: Each cell shows the relationship of person in each row with that of the person in the corresponding column.


This one is in Marathi. I had also created one in English, but with all Kaka/ Mama named as Uncles and Aatya /Maushis as Aunts, it wasn't as much fun enough.

Friday, June 3, 2016

Infographic: Birthday Calendar

Today's infographic is based on calendar data type. For each month of the year, it shows the day of the week that a particular person was born on. 


MS-Excel is a pretty powerful tool, with a range and depth of functions that's quite mind-blowing. This infographic makes use of a nice little Excel function that allows you to convert any date (in this case, the birthdate available in Facebook profile information) into the respective weekday.